PowerPointを操ることができるPythonライブラリ「python-pptx」のインストールは次のようにcondaで出来ます。
conda install -c conda-forge python-pptx
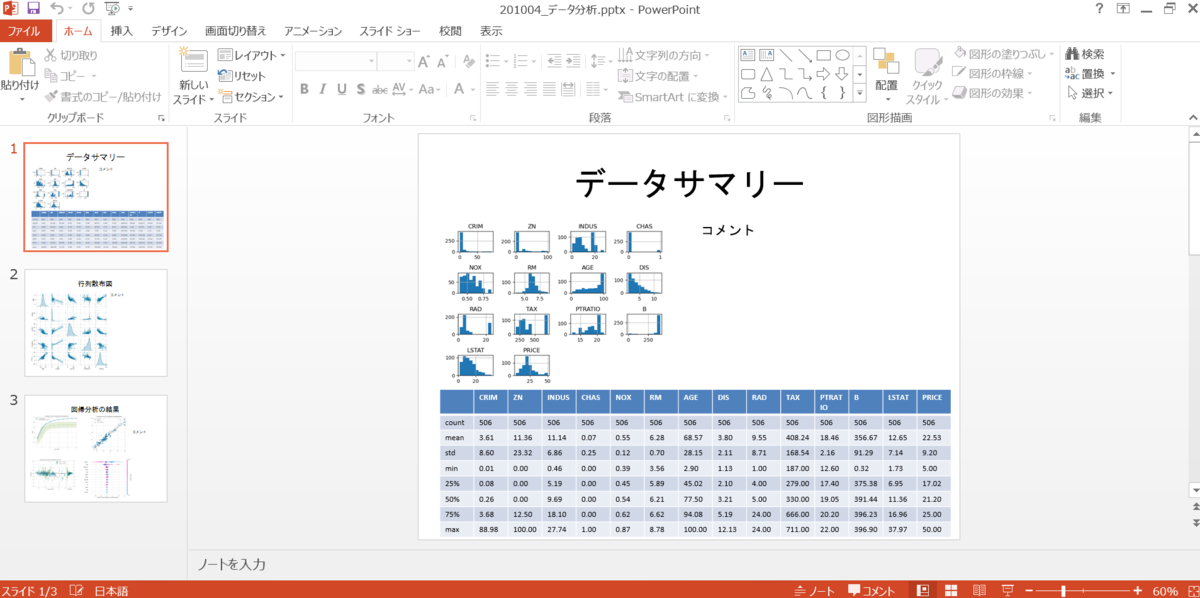
本記事では、パワーポイントのスライドを次のような3つのレイアウトでひとつのファイルに自動作成する雛形コードを載せました。それぞれ関数として呼び出せる仕様にしています。

一つ目は、下図のように左上部に1枚の画像ファイルを貼り付け、下部に読み込んだcsvファイルのデータを表にして作成し、右上部にテキストを挿入するレイアウトです(コード中の関数名はcreate_slide_patternA)。参考までに、図中の左上図はpandasのdf.hist()によるヒストグラムで、下の表はpandasのdf.describe()による基本統計量です。

二つ目は、下図のように1枚の画像ファイルを左に貼り付け、右部にテキストを挿入するレイアウトです(コード中の関数名はcreate_slide_patternB)。参考までに、図中の行列散布図はseabornによるsns.pairplot()で作成できます。

三つ目は、4枚の画像を貼り付け、右側にテキストを挿入するレイアウトです(コード中の関数名はcreate_slide_patternC)。参考までに図中の分析結果は、PyCaretによるランダムフォレストの回帰分析の結果です。左上図は学習曲線、右上図は適合度、左下図は残渣、右下図は特徴量の感度を示すシャープレイ値(Shapley value)です。

■本プログラム
図中の画像ファイルやcsvファイルは、次のリンク先で作成したものです。Python 「PyCaret」ハイパーパラメータの自動チューニング【カスタムパラメータ設定の方法】 - PythonとVBAで世の中を便利にする
#!/usr/bin/env python3
# coding: utf-8
# conda install -c conda-forge python-pptx
import pandas as pd
import pptx
from pptx.util import Cm, Pt
import japanize_matplotlib
import datetime
now = datetime.datetime.now()
now = now.strftime("%y%m%d")

# 画像と表とテキストを挿入する関数
def create_slide_patternA(ppt, mytitle, img_path, csv_path, my_text):
    slide = ppt.slides.add_slide(ppt.slide_layouts[5])
    title = slide.shapes.title
    title.text = mytitle

    df = pd.read_csv(csv_path)

    columns = df.columns.tolist()
    columns[0] = ''
    columns_list = list([columns])
    print(columns_list)
    data_list = columns_list + df.values.tolist()
    print(data_list)

    #挿入する位置、幅高さ、行列
    table_left = Cm(1)
    table_top = Cm(12)
    table_width = Cm(24)
    table_height = Cm(5)
    row, col = df.shape
    table = slide.shapes.add_table(row+1, col, # 行列
                                  table_left,
                                  table_top, # 挿入位置
                                  table_width,
                                  table_height).table

    #表にデータを入力
    table_font_size = 11
    for i in range(row + 1):
        for j in range(col):
            cell = table.cell(i, j)
            buf = data_list[i][j]
            if str(data_list[i][0]) == 'count' and j != 0:
                print(data_list[i][0])
                cell.text  = str(int(buf))
            elif type(buf) is float:
                print(buf)
                print('{:.2f}'.format(buf))
                cell.text  = str('{:.2f}'.format(buf))
            else:
                cell.text = str(data_list[i][j])
            cell.text_frame.paragraphs[0].font.size = Pt(table_font_size)

    # 画像を挿入
    img_left = Cm(1)
    img_top = Cm(4)
    img_height = Cm(8)
    slide.shapes.add_picture(img_path,
                            img_left,
                            img_top,
                            height=img_height)

    text_left = Cm(13)
    text_top = Cm(4)
    text_width = Cm(10)
    text_height = Cm(8)
    textbox = slide.shapes.add_textbox(text_left,
                                        text_top,
                                        text_width,
                                        text_height)
    textbox.text = my_text
    textbox.text_frame.add_paragraph().font.size = Pt(textbox_fontsize)


# 画像とテキストを挿入する関数
def create_slide_patternB(ppt, mytitle, img_path, my_text):
    slide = ppt.slides.add_slide(ppt.slide_layouts[5])

    title_holder = slide.shapes.placeholders[0]
    title_frame = title_holder.text_frame
    title_frame.paragraphs[0].text = mytitle
    title_frame.paragraphs[0].font.size = Pt(36)

    left, top, width = Cm(1), Cm(4), Cm(14)
    slide.shapes.add_picture(img_path, left, top, width=width)

    text_left = Cm(15)
    text_top = Cm(4)
    text_width = Cm(10)
    text_height = Cm(8)
    textbox = slide.shapes.add_textbox(text_left,
                                        text_top,
                                        text_width,
                                        text_height)
    textbox.text = my_text
    textbox.text_frame.add_paragraph().font.size = Pt(textbox_fontsize)


# 画像4枚とテキストを挿入する関数
def create_slide_patternC(ppt, mytitle, img_path_list, my_text):
    slide = ppt.slides.add_slide(ppt.slide_layouts[5])

    title_holder = slide.shapes.placeholders[0]
    title_frame = title_holder.text_frame
    title_frame.paragraphs[0].text = mytitle
    title_frame.paragraphs[0].font.size = Pt(36)

    left, top, width = Cm(0.5), Cm(3), Cm(10)
    slide.shapes.add_picture(img_path_list[0], left, top, width=width)
    left, top, width = Cm(9.5), Cm(3), Cm(11)
    slide.shapes.add_picture(img_path_list[1], left, top, width=width)
    left, top, width = Cm(0.5), Cm(11), Cm(9)
    slide.shapes.add_picture(img_path_list[2], left, top, width=width)
    left, top, width = Cm(10.5), Cm(10.5), Cm(10)
    slide.shapes.add_picture(img_path_list[3], left, top, width=width)

    text_left = Cm(19)
    text_top = Cm(6)
    text_width = Cm(6)
    text_height = Cm(8)
    textbox = slide.shapes.add_textbox(text_left,
                                        text_top,
                                        text_width,
                                        text_height)
    textbox.text = my_text
    textbox.text_frame.add_paragraph().font.size = Pt(textbox_fontsize)


def main():
    prs = pptx.Presentation()
    create_slide_patternA(prs,
                          'データサマリー',
                          '03_hist.png',
                          'boston_dataset_describe.csv',
                          'コメント')
    create_slide_patternB(prs,
                          '行列散布図',
                          '21_pairplot.png',
                          'コメント')

    img_path_list = ['14_tuned_reg_vc.png', '15_tuned_reg_error.png',
                     '16_tuned_reg_residuals.png', '19_tuned_reg_feature_summary.png']
    create_slide_patternC(prs,
                          '回帰分析の結果',
                          img_path_list,
                          'コメント')

    prs.save(save_file_name)

if __name__ == "__main__":
    textbox_fontsize = 22
    save_file_name = now + '_データ分析.pptx'

    main()
    print('finished')
以上
<広告>