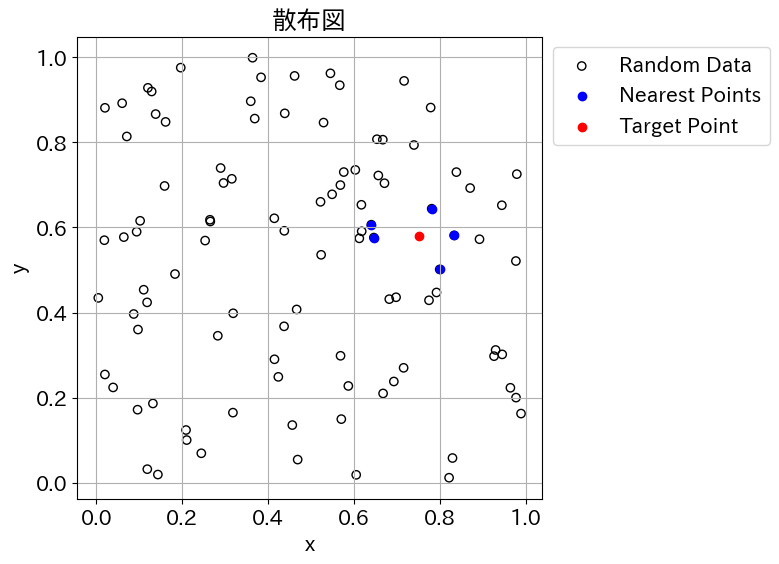
下図は、本プログラムの実行例です。100個のランダムデータがあって、赤点は任意に指定したx,y座標 (0.75, 0.58)です。青点はプログラム実行によって得られた赤点に最も近いN=5個を抽出した結果です。
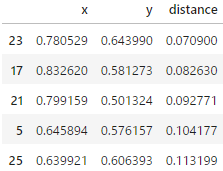
下図は、上記の青点のデータである。pandasデータフレームで取得する。
■本プログラム
import pandas as pd
import numpy as np
import matplotlib.pyplot as plt
import japanize_matplotlib
plt.rcParams['font.size'] = 15
np.random.seed(1)
data = {
'x': np.random.uniform(0, 1, 100),
'y': np.random.uniform(0, 1, 100)
}
df = pd.DataFrame(data)
target_x, target_y = 0.75, 0.58
df['distance'] = np.sqrt((df['x'] - target_x)**2 + (df['y'] - target_y)**2)
N = 5
nearest_points = df.nsmallest(N, 'distance')
plt.figure(figsize=(6, 6))
plt.scatter(df['x'], df['y'], facecolor='None', edgecolors='black', label='Random Data')
plt.scatter(nearest_points['x'], nearest_points['y'], color='blue', label='Nearest Points')
plt.scatter(target_x, target_y, color='red', label='Target Point')
plt.xlabel('x')
plt.ylabel('y')
plt.title('散布図')
plt.legend(loc='upper left', bbox_to_anchor=(1, 1))
plt.grid(True)
plt.show()
以上
<広告>
リンク
リンク